
Year
2026
Type of work
Digital
Tag
Tools
A single phone call can give us the price of a coffee. Thousands of calls can give us a way to examine a city. Together with Cedra, we built a research process that reaches bars, bakeries, cafés and restaurants, asks one consistent question and turns their answers into a dataset.
In Barcelona, we called 2,411 establishments and collected 836 prices for a tallat: an espresso with a little milk. This small, everyday purchase became our starting point for investigating much larger questions about tourism, gentrification and inflation: who the local economy serves, what remains affordable and how prices change over time.
2026 · Barcelona, Spain · A research project by Domestic Data Streamers and Cedra.

Each dot represents one establishment in the sampling frame. 836 prices came from 2,411 establishments called.
Asking the city, at scale.
The question was deliberately simple: “How much is a cortado with cow’s milk?” Keeping the product and the question consistent made it possible to compare answers across very different establishments. The value of the system lies in doing this at scale: collecting information directly from thousands of places where everyday economic life happens.
We selected establishments across Barcelona’s 73 neighbourhoods, using published business listings and neighbourhood quotas. Between 10 and 23 September 2026, an automated calling system with a recorded introduction contacted 2,411 of them, with up to three attempts per establishment. Conversations were transcribed and reviewed by hand. Each valid response contributed one price; an unanswered call contributed none.
The result was 836 recorded prices. The median was €1.70. More than a citywide figure, we now had observations that could be located, grouped and compared: a new layer of information built from a question any customer could ask.

One dot per recorded price, grouped in five-cent bins. The median is €1.70; 148 establishments quoted €2 or more.
One price becomes several questions.
A price tells us little on its own. To understand its surroundings, we connected our observations with Airbnb listings from Inside Airbnb and neighbourhood economic data from Open Data BCN. Income per person, population, licensed tourist accommodation, hotels and points of interest added different views of the same city.
We brought these sources together using a shared neighbourhood identifier. Population data let us compare tourism measures per resident, while neighbourhood price summaries let us examine typical prices, their spread and the share of establishments charging €2 or more. The neighbourhood analysis covered the 43 areas with at least eight recorded prices; results based on eight to fourteen prices remained provisional.

15,406 public, approximate listing locations. Inside Airbnb, 24 June 2026.
Reading the pressures on the local economy.
Across those neighbourhoods, tourism was more closely associated with the median coffee price than residents’ income. Sarrià and the Gothic Quarter make the contrast concrete. Annual income per person was €41,475 in Sarrià and €22,248 in the Gothic Quarter, yet the median cortado was cheaper in Sarrià: €1.80 against €1.90. The two areas had 3 and 32 Airbnb listings per 1,000 residents respectively.
These comparisons open a way to investigate how an economy serving visitors overlaps with the everyday economy of residents. They place a familiar expense within wider questions about tourism and gentrification: who an area caters to, what remains affordable and how the cost of ordinary routines differs across the city.
This first measurement records an association. It does not demonstrate that tourism caused a price increase, or measure displacement. Even when we compare areas at similar distances from the centre, the pattern remains a clue to investigate. The sample also has limits: establishments without published phone numbers are absent, and quoted prices are not observed receipts.
A measurement we can repeat.
The same calling process can be repeated. A second measurement is planned for September 2027 at the same establishments, allowing us to compare prices over time as well as across neighbourhoods.
That is where the project begins to address inflation and the changing geography of affordability. Following the same purchase can show where prices rise and how unevenly. Understanding whether those changes reflect wider inflation, tourism or gentrification will require the repeated observations and contextual data together. The 2026 edition establishes the starting point.
Then, making the research public.
Only after collecting, reviewing and connecting the data did we create an interactive experience to explain it. The design starts from the research question and lets the visitor form an expectation before encountering the findings.
A telephone rings. Visitors answer, drag a cup to guess the price and watch the 836 observations take their places in a distribution. They choose the neighbourhood they expect to be most expensive, then compare their intuition with the map. Two illustrated bars place income, coffee prices and tourism side by side. The experience ends with a receipt bringing together the findings and the visitor’s guesses.
The game, available in ten languages, sits alongside a research website, a method annex and anonymised open data. These are different ways into the same work: making the research understandable, while keeping its evidence and limitations available to anyone who wants to look more closely.
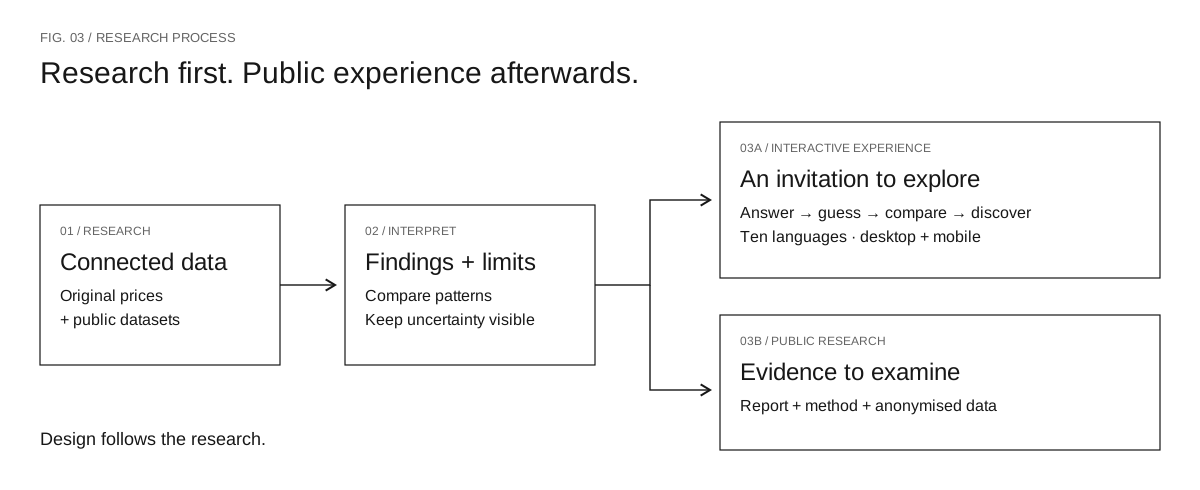
The collected and connected data inform the findings. Those findings guide the interactive experience, research report and open-data publication.

Illustrated desktop and mobile concept for El cens del tallat. The fieldwork was conducted by telephone.

The call — A ringing telephone becomes an invitation to ask the city one small question.

The map — A guess about the most expensive neighbourhood becomes a way into the geography of prices.

Illustrated interface storyboard: the opening question, price distribution, maps and neighbourhood comparisons. This is a design overview; the verified findings are reported in the case text and linked research.

Illustrated comparison of Sarrià and the Gothic Quarter. The reported coffee prices are medians, and the tourism figures count Airbnb listings per 1,000 residents.

Illustrated research workflow. The study called 2,411 establishments, recorded 836 prices and linked observations by neighbourhood.
Explore El cens del tallat
Project information
El cens del tallat · Barcelona 2026
Fieldwork: 10–23 September 2026
A project by Domestic Data Streamers and Cedra. Data sources: Cedra; Ajuntament de Barcelona / Open Data BCN; Inside Airbnb (24 June 2026); Google Maps. With thanks to the establishments that answered, Murray Cox and the Inside Airbnb team, and Open Data BCN.
